One token page, two minds: the curious and the active.
A page split between two jobs.
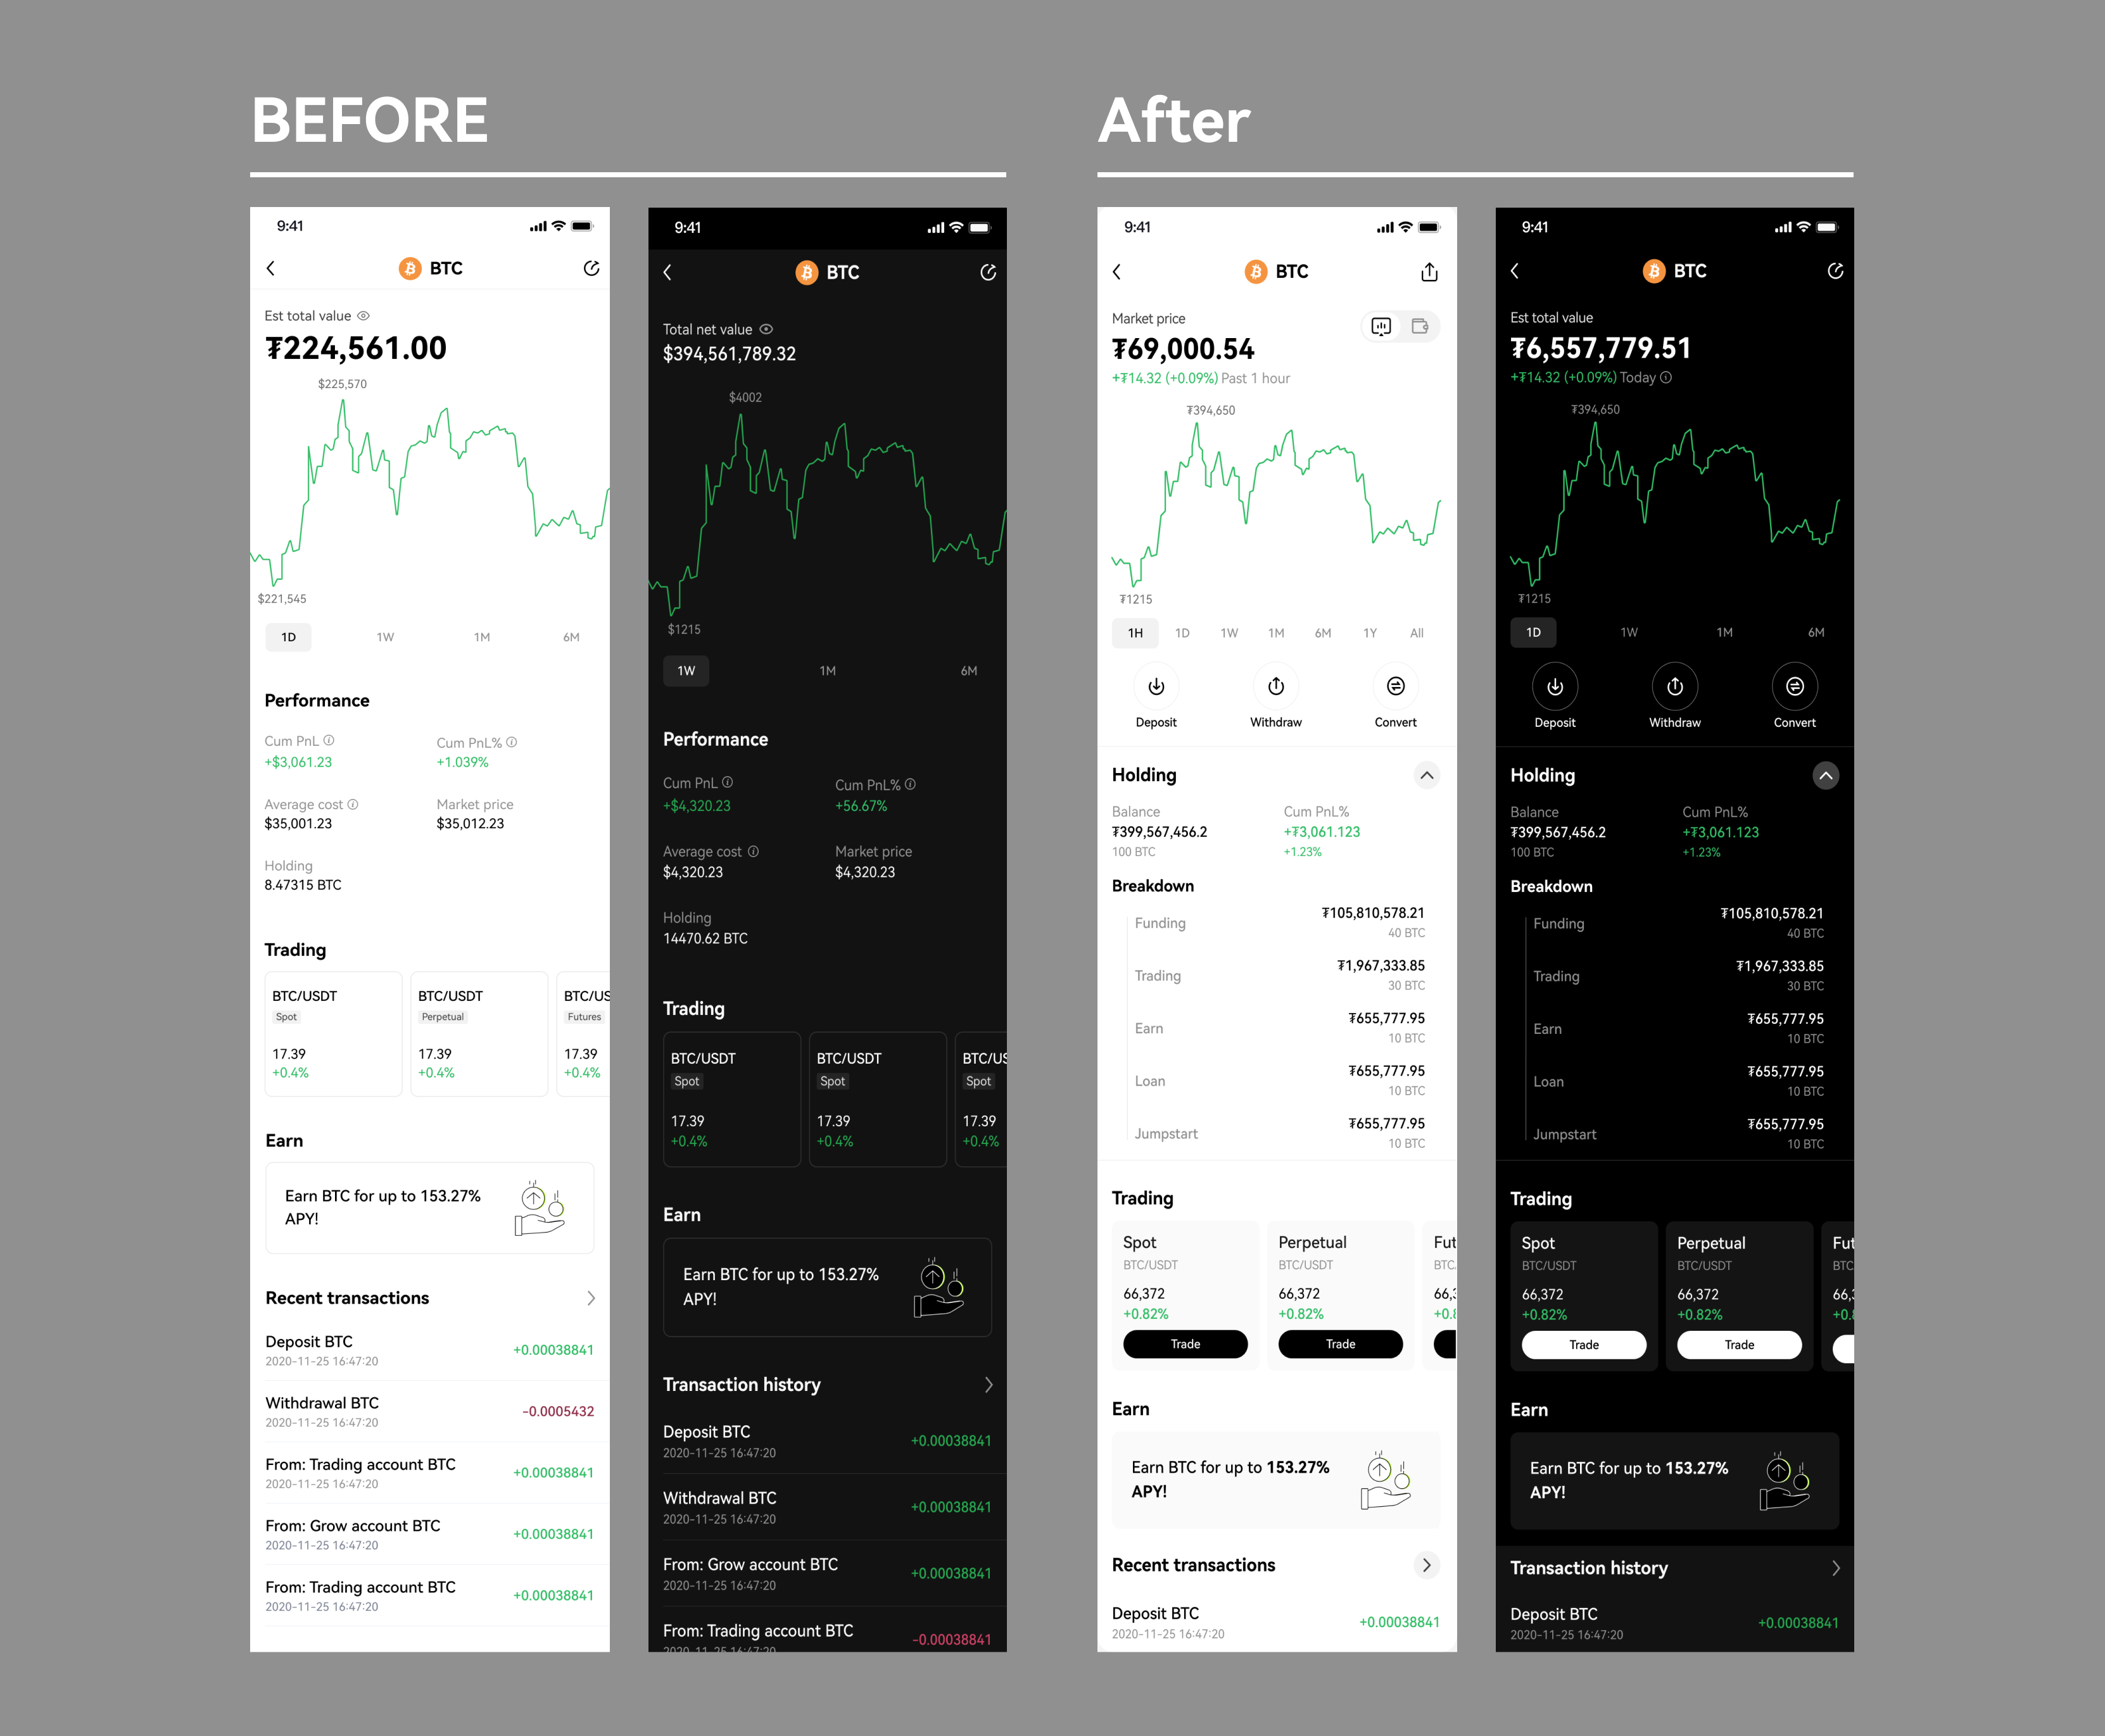
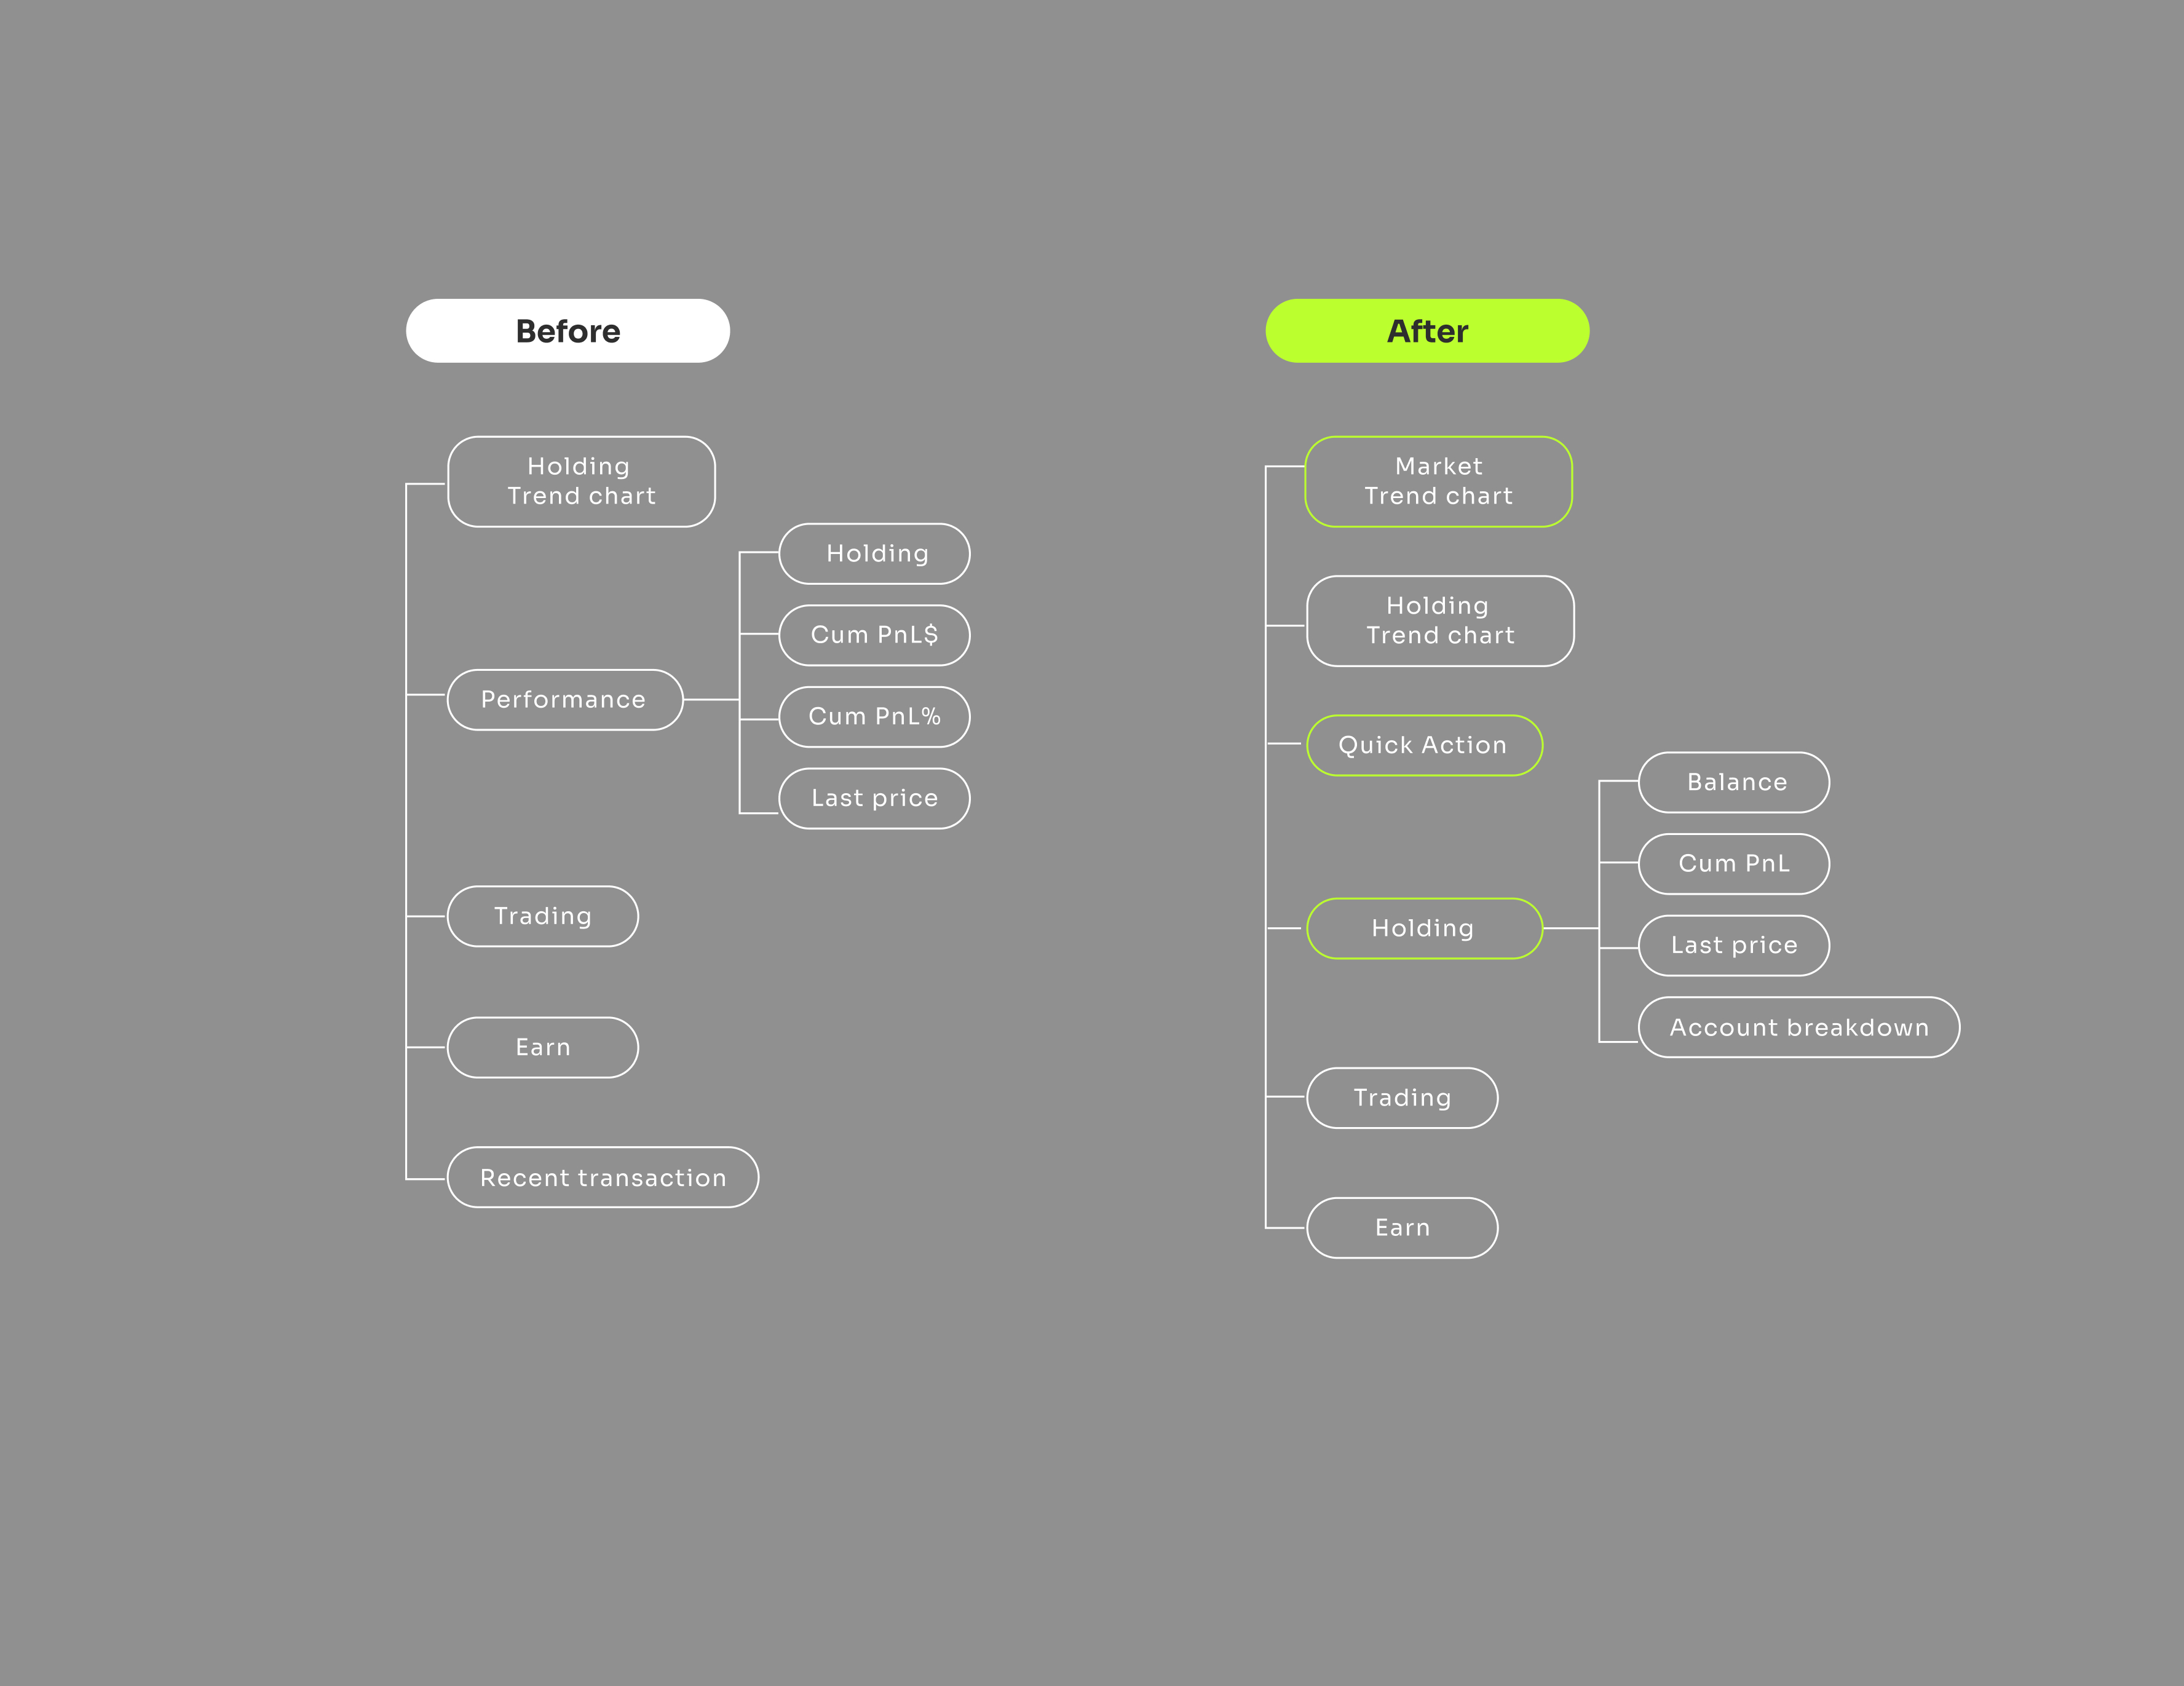
The legacy token detail page tried to be both a holdings statement and a market chart at the same time — and did neither well. Newcomers couldn't find the price; active traders couldn't see their PnL without scrolling past marketing modules.
We re-framed the page around a single user intent — "tell me about this token, in my portfolio context" — and built a toggle that swaps the hero between market view and holdings view.
Holdings ↔ Market, one tap apart.
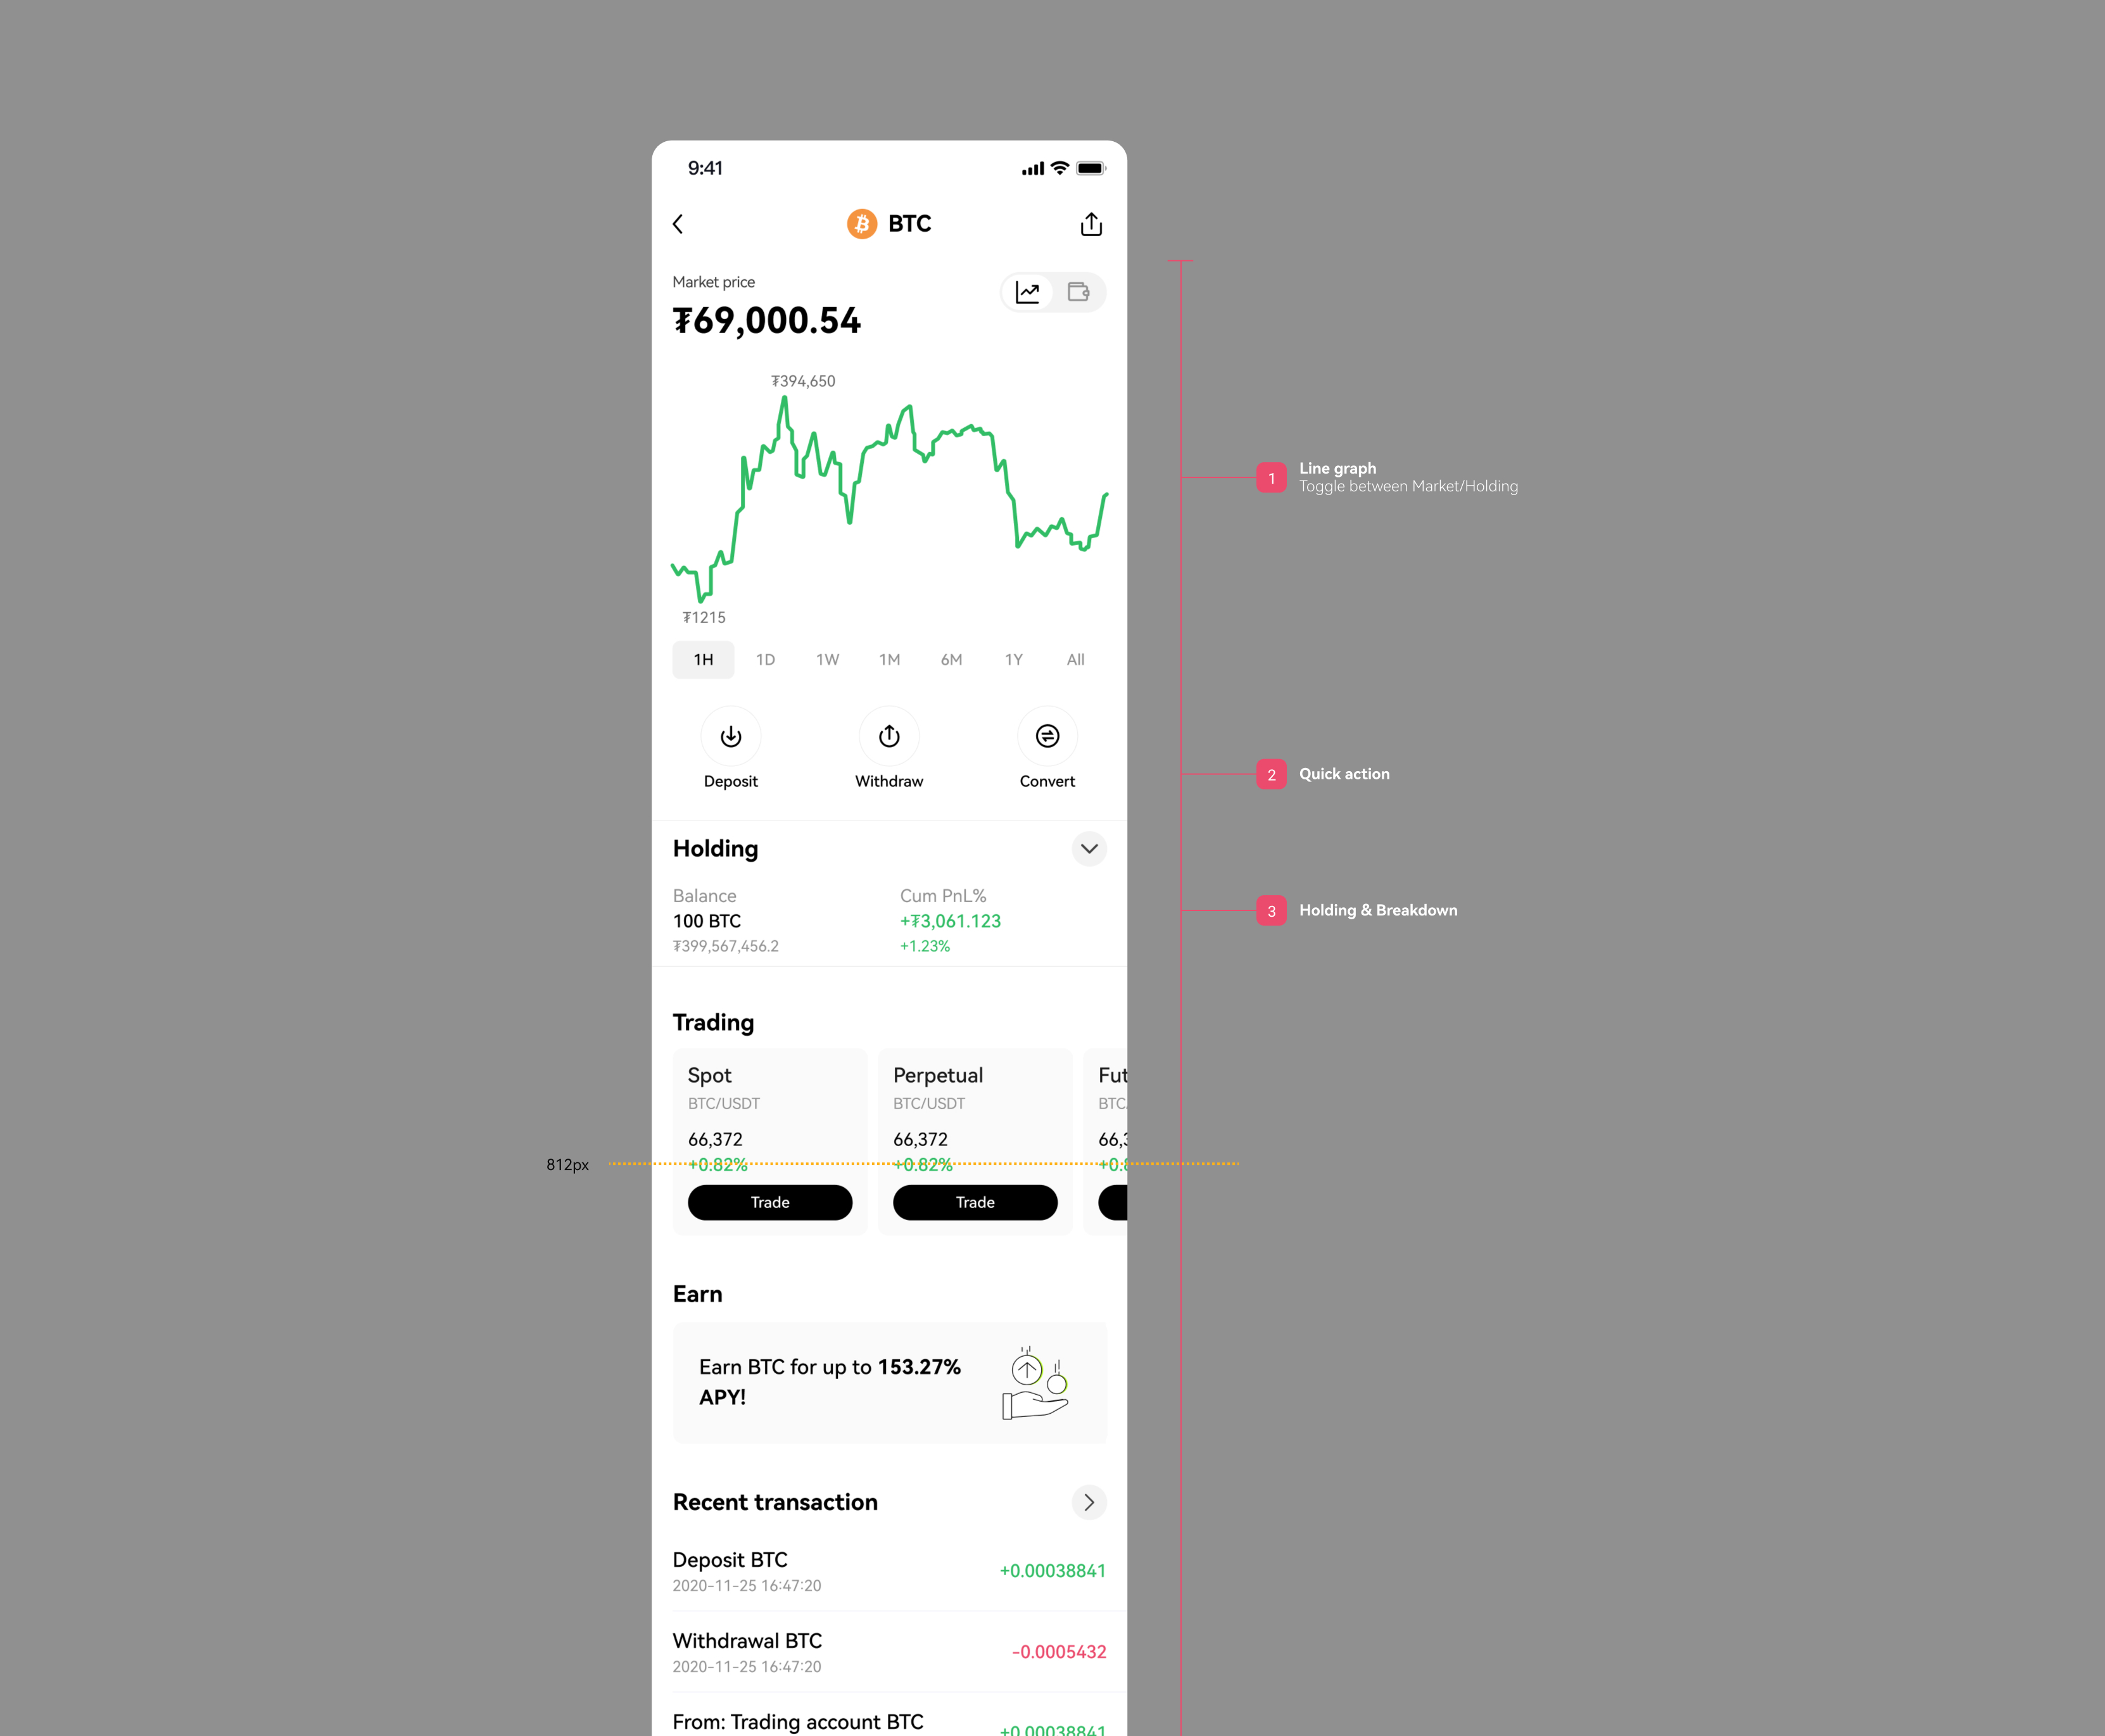
A segmented toggle in the top-right of the hero swaps the lead metric between Total Net Value (holdings) and Market Price. The chart, axis ticks, and quick-action row re-render without a page transition, so the user never loses context.
A componentized chart, four time-scales.
The chart component reads price, volume and PnL series from the same data source and renders them with a shared axis primitive. Time-range chips (1H, 1D, 1W, 1M, 6M, 1Y, All) hot-swap the window without re-mounting the SVG — keeping the line animation continuous.
Focus beats density.
- ↗ +29% token-page → trade conversion
- ↗ +16% holding-view engagement (sessions ≥ 30s)
- ↘ –22% bounce on first token open
- ↗ Chart component reused across 6 surfaces